

Working with this resource via an AI agent? Datum publishes a Metrics Export skill that teaches agents the canonical patterns for this resource.
Exporting to Grafana
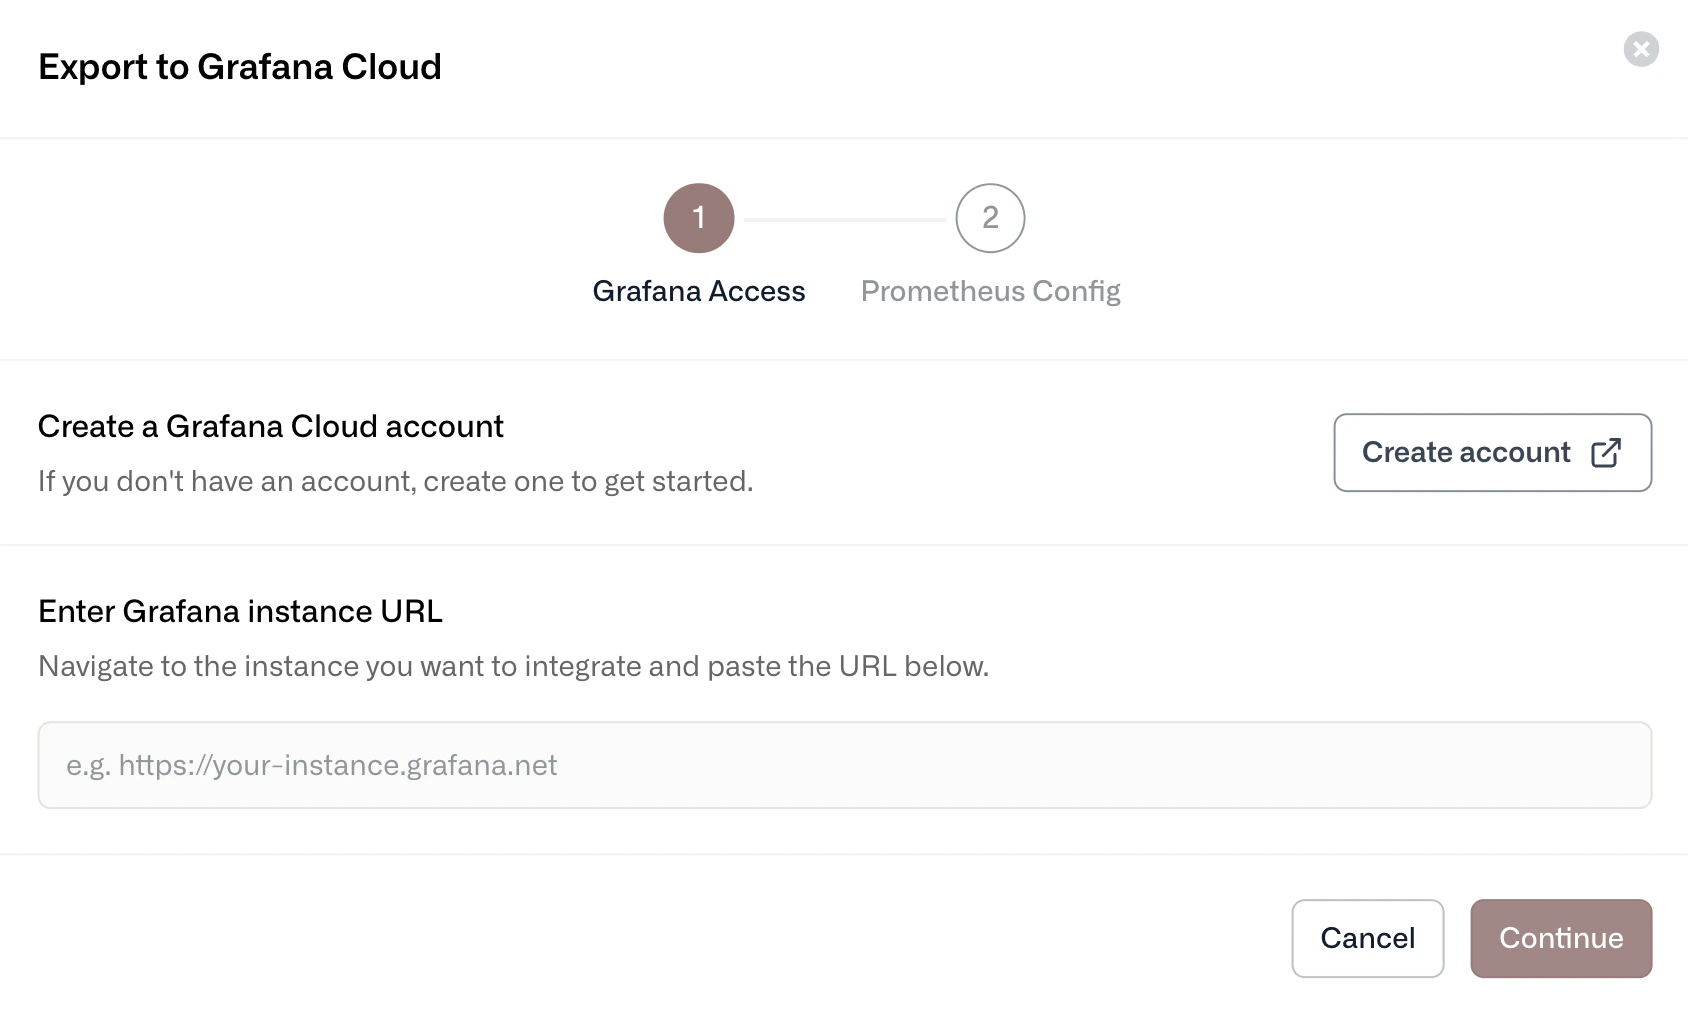
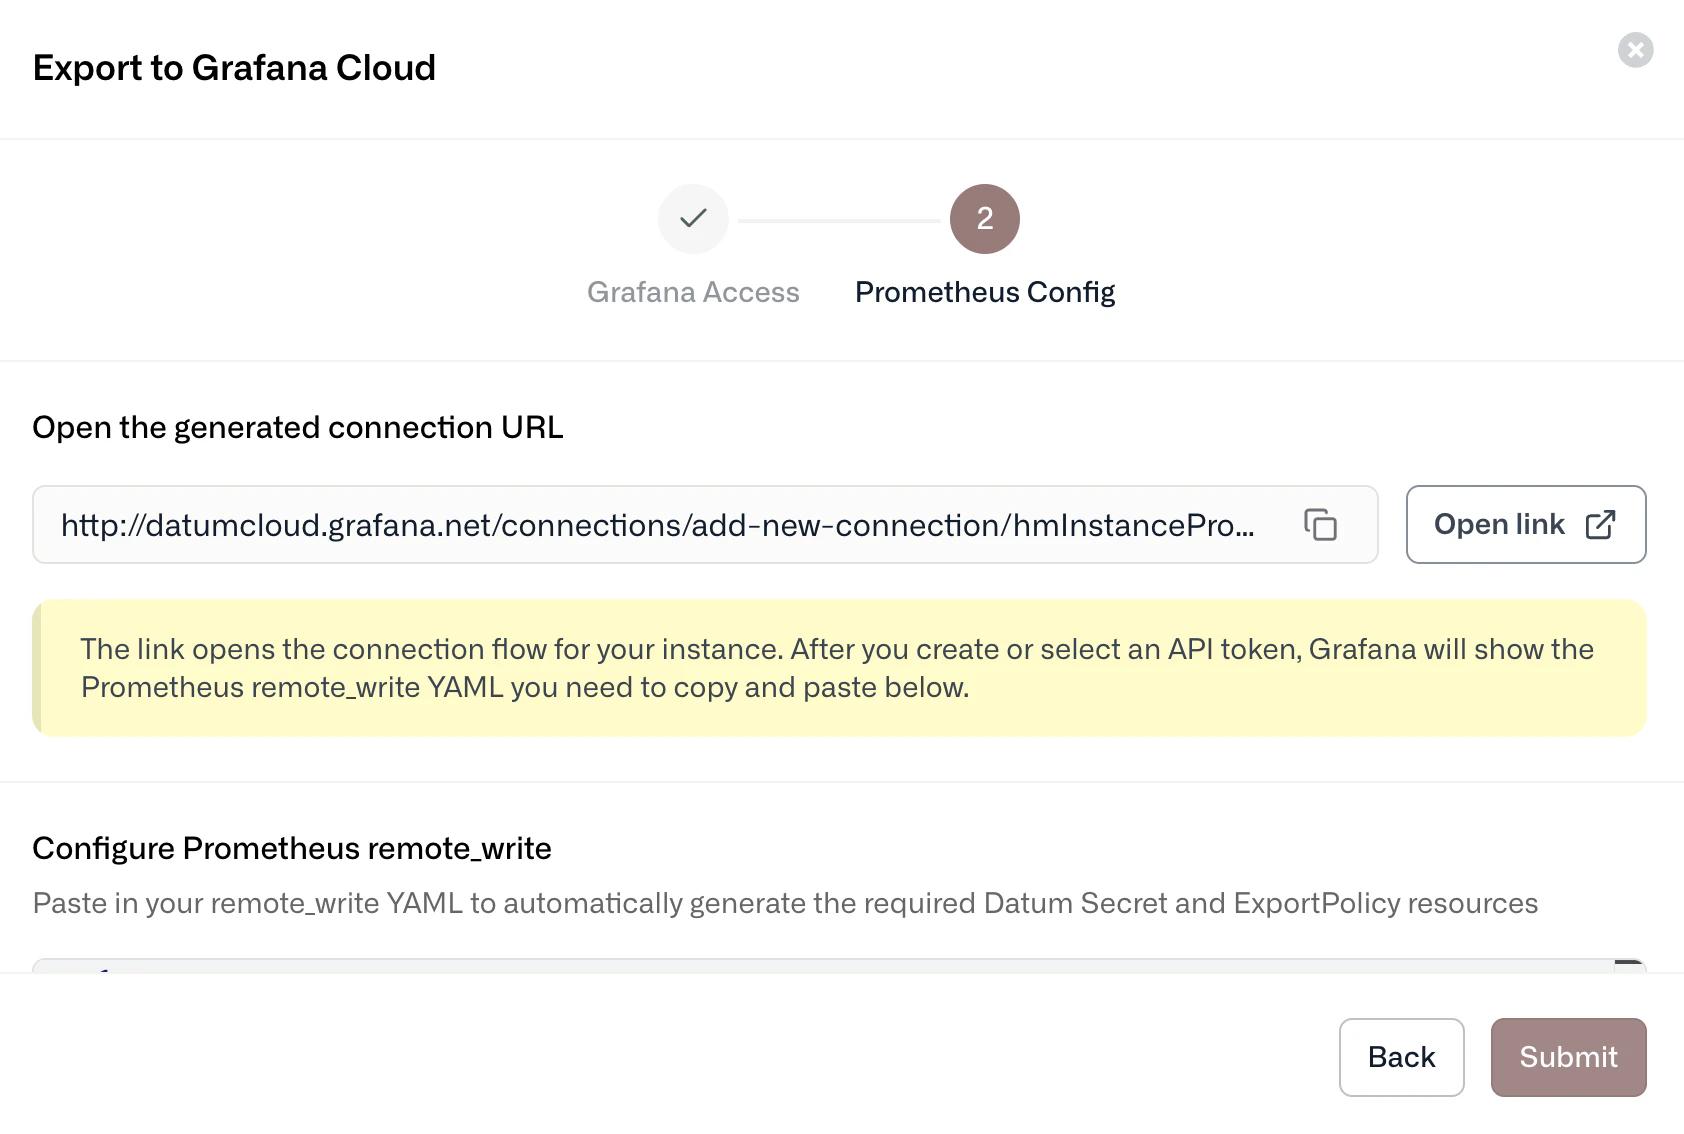
We support exporting metrics to Grafana Cloud using ExportPolicies. Each ExportPolicy defines:- Sources: Select metrics using MetricSQL queries to filter which telemetry data to export
- Sinks: Configure destination endpoints where metrics should be sent (Prometheus remote write endpoints for Grafana Cloud)
Datum dashboards in Grafana Cloud
To add prebuilt Datum dashboards in Grafana Cloud, go to Dashboards, select New dashboard, then select Import dashboard. Load the Datum dashboards using the following Grafana IDs.Datum Overview
Grafana ID: 23939 Provides real-time visibility into Datum Proxy infrastructure, including:- Total HTTP proxies, hostnames, and domains
- Upstream requests per second (RPS) by region
- Global response codes and latency percentiles
- Domain and proxy health status
Datum Proxy
Grafana ID: 24261 Offers a real-time view of HTTP proxy hostnames and regional upstream traffic, including:- Regional RPS and upstream response codes
- Latency percentiles (p90, p99)
- Domain and proxy status