

Working with this resource via an AI agent? Datum publishes a Metrics Export skill that teaches agents the canonical patterns for this resource.
What Datum measures
Metrics come in two kinds:
- Traffic and usage metrics measure what your resources are doing, such as requests per second or CPU time. Their names start with the component that records them, such as
envoy_for load balancer traffic,coraza_for the firewall, anddatum_compute_instance_for Instance CPU and memory. - Status metrics report the state of your resources, such as whether a load balancer is programmed or a domain is verified. They follow a consistent pattern, so once you know one, you know them all:
Labels on every series
Queries use MetricsQL, which also accepts standard PromQL.
Export with the Cloud Portal
You can set up an export policy in the Datum Cloud portal. Go to the project of your choice, find the Metrics tab, and follow the instructions.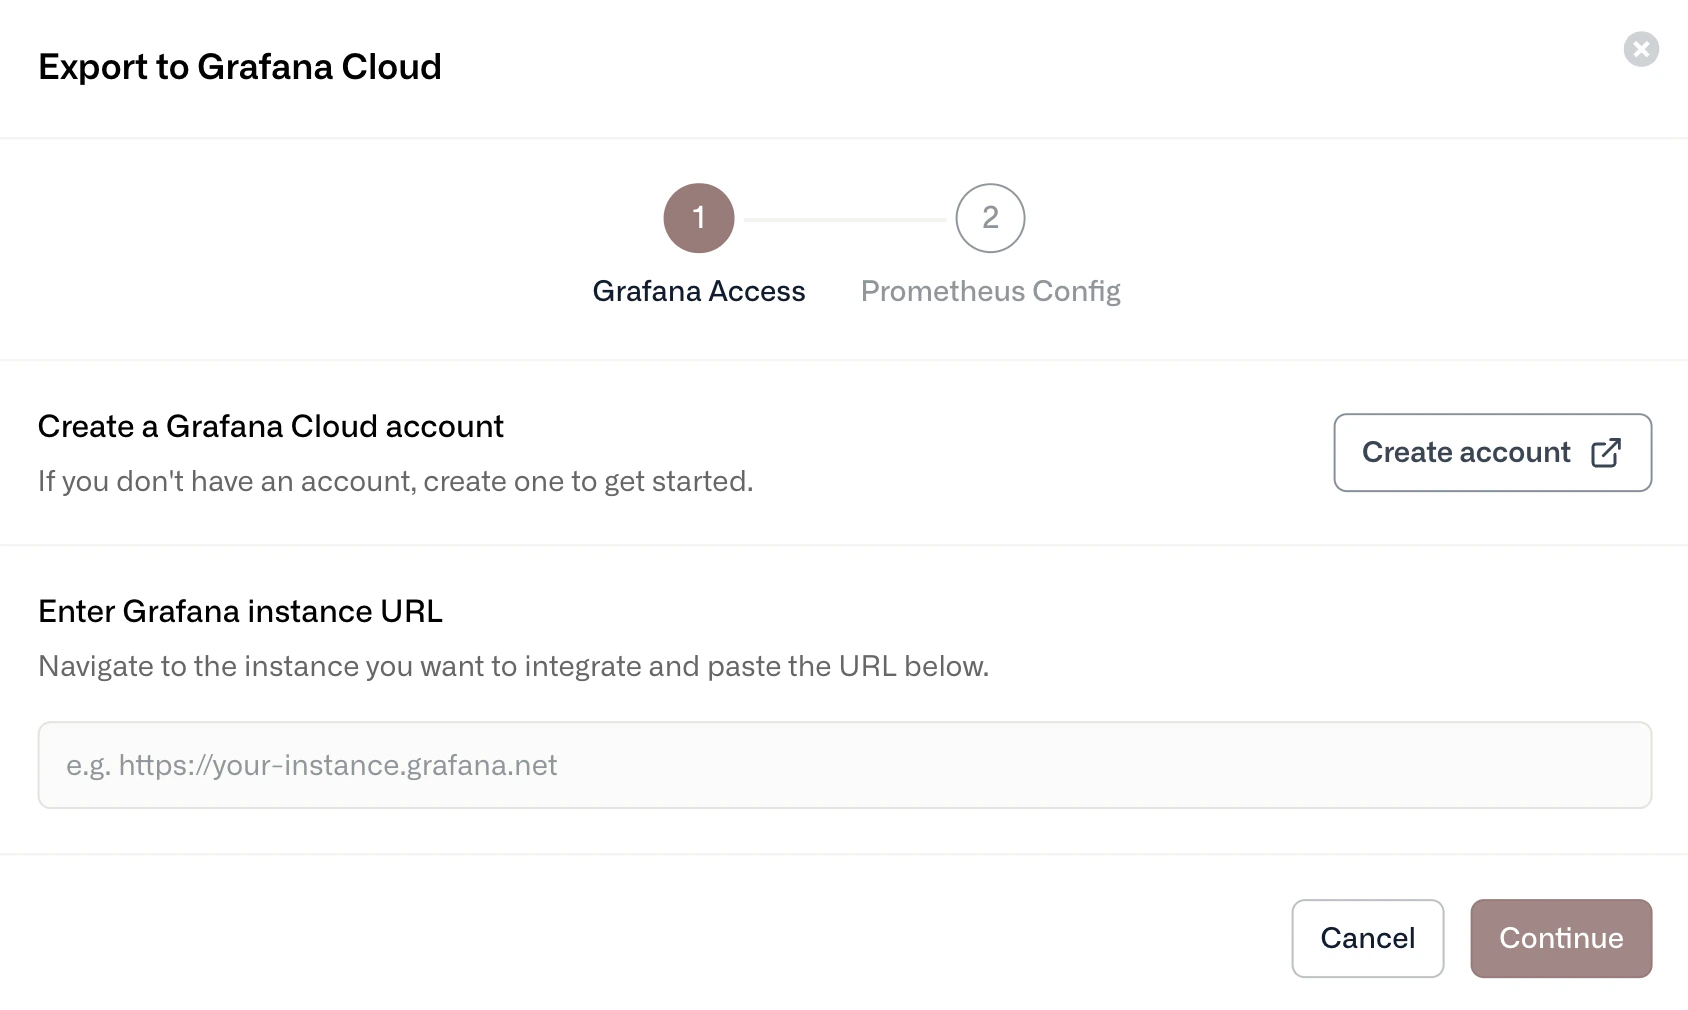
Step 1: Provide the Grafana instance URL
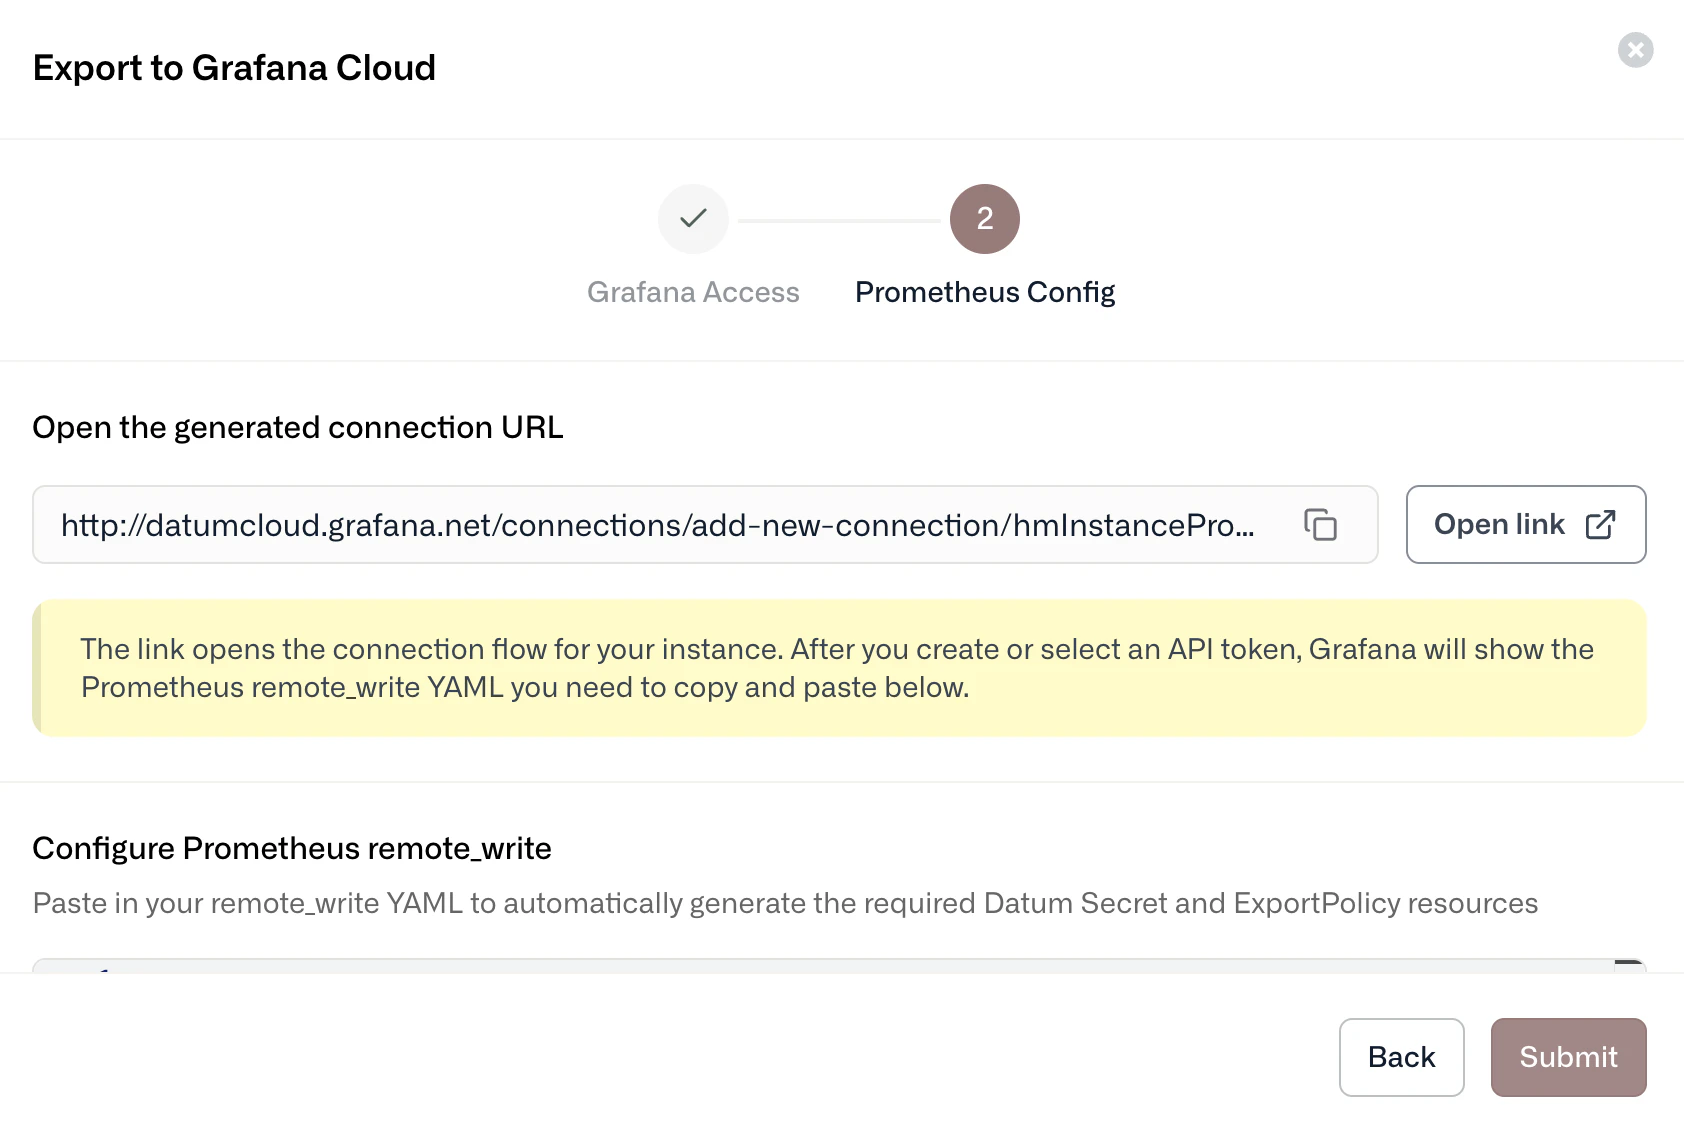
Step 2: Configure your export policy
Export with datumctl
AnExportPolicy defines:
- Sources, which select the metrics to export. Each source needs a MetricsQL selector in
metrics.metricsql, and exports only the matching series. To export everything in your project, use{__name__=~".+"}. The selector must be a plain series selector such as{label="value"}, not a function likerate(). Datum limits it to your project for you. - Sinks, which send the selected sources to a Prometheus remote-write endpoint.
1
Store your credentials in a Secret
Create a Secret with the credentials for your endpoint. It must be of type
kubernetes.io/basic-auth, with username and password keys. For Grafana Cloud, the username is your instance ID and the password is an access token with permission to write metrics.2
Create the export policy
This policy exports only load balancer traffic and firewall metrics. To export everything, set Replace
metricsql to {__name__=~".+"}.endpoint with your own remote-write URL. If you leave out batch or retry, the defaults are batches of 500 every 5s and 3 attempts 5s apart.3
Check that it's exporting
Ready condition is True once every sink is accepted. Each sink also has an Accepted condition in status.sinks. If it’s False with reason InvalidAuthentication, the Secret is missing, isn’t of type kubernetes.io/basic-auth, or lacks a username or password key.Accepted means the configuration is valid, not that the endpoint received data. To confirm delivery, query your endpoint for your project’s metrics after a minute or two.Datum dashboards in Grafana Cloud
To add prebuilt Datum dashboards in Grafana Cloud, go to Dashboards, select New dashboard, then select Import dashboard. Load the Datum dashboards using the following Grafana IDs.Datum Overview
Grafana ID: 23939 Provides real-time visibility into your load balancers, including:- Total HTTP proxies, hostnames, and domains
- Upstream requests per second (RPS) by region
- Global response codes and latency percentiles
- Domain and proxy health status
Datum Proxy
Grafana ID: 24261 Offers a real-time view of one load balancer’s hostnames and regional traffic, including:- Regional RPS and upstream response codes
- Latency percentiles (p50, p90, p99)
- Domain and proxy status