

Metrics
The Cloud Portal shows CPU and memory usage on Compute workload and Instance pages. Open the Metrics tab for a longer view. Datum also publishes the measurements to your project’s metrics store so you can query them or export them to Grafana Cloud.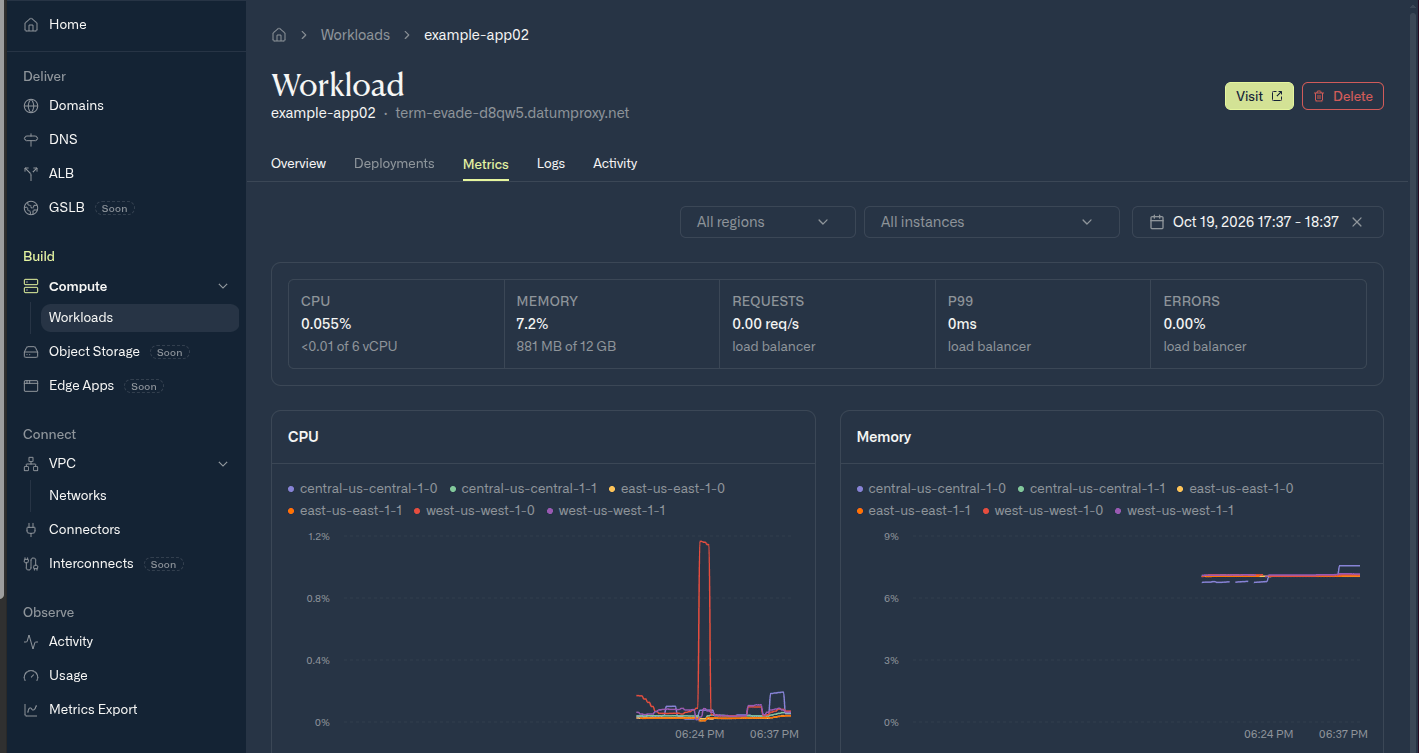
A workload's Metrics tab, with CPU and memory for each Instance
CPU and memory series
Each series measures one container in an Instance. These measurements don’t represent total virtual machine memory or include a separate virtual machine overhead measurement. An Instance’s quota and configured size also differ from measured usage.
Use these labels to select the series you need:
Query an Instance
ReplacePROJECT_ID and INSTANCE_NAME with your project ID and an Instance name returned by datumctl compute instances --workload=WORKLOAD_NAME. Run these MetricsQL queries in your metrics tool:
0.5 means approximately half of one CPU core over the five-minute window.
instance_container in the result:
datumctl compute instances --workload=WORKLOAD_NAME, then select those names in resource_name. The metrics don’t carry a workload-name label.
Workload and Instance status series
Datum also publishes the state of your workloads and Instances, so you can alert when a workload falls short of the Instances it wants. These are the same numbers thatdatumctl compute workloads shows:
On these series,
resource_name is the workload or Instance name, and resourcemanager_datumapis_com_project_name is your project ID.
To find placements that are short of Instances, replace PROJECT_ID:
Traffic to published workloads
A workload published through an ALB has the same traffic, latency, and firewall metrics as any other load balancer. Select them withgateway_name set to the load balancer’s name, which datumctl alb list shows. See ALB metrics.
Logs
Open a workload’s Logs tab in the Cloud Portal to see output from its Instances. If the workload is published through an ALB, the same view also includes ALB access logs. Open an Instance’s Logs tab to focus on that Instance’s output and related ALB requests. The Overview pages show recent logs, and the Logs tabs provide a larger explorer with time and search controls.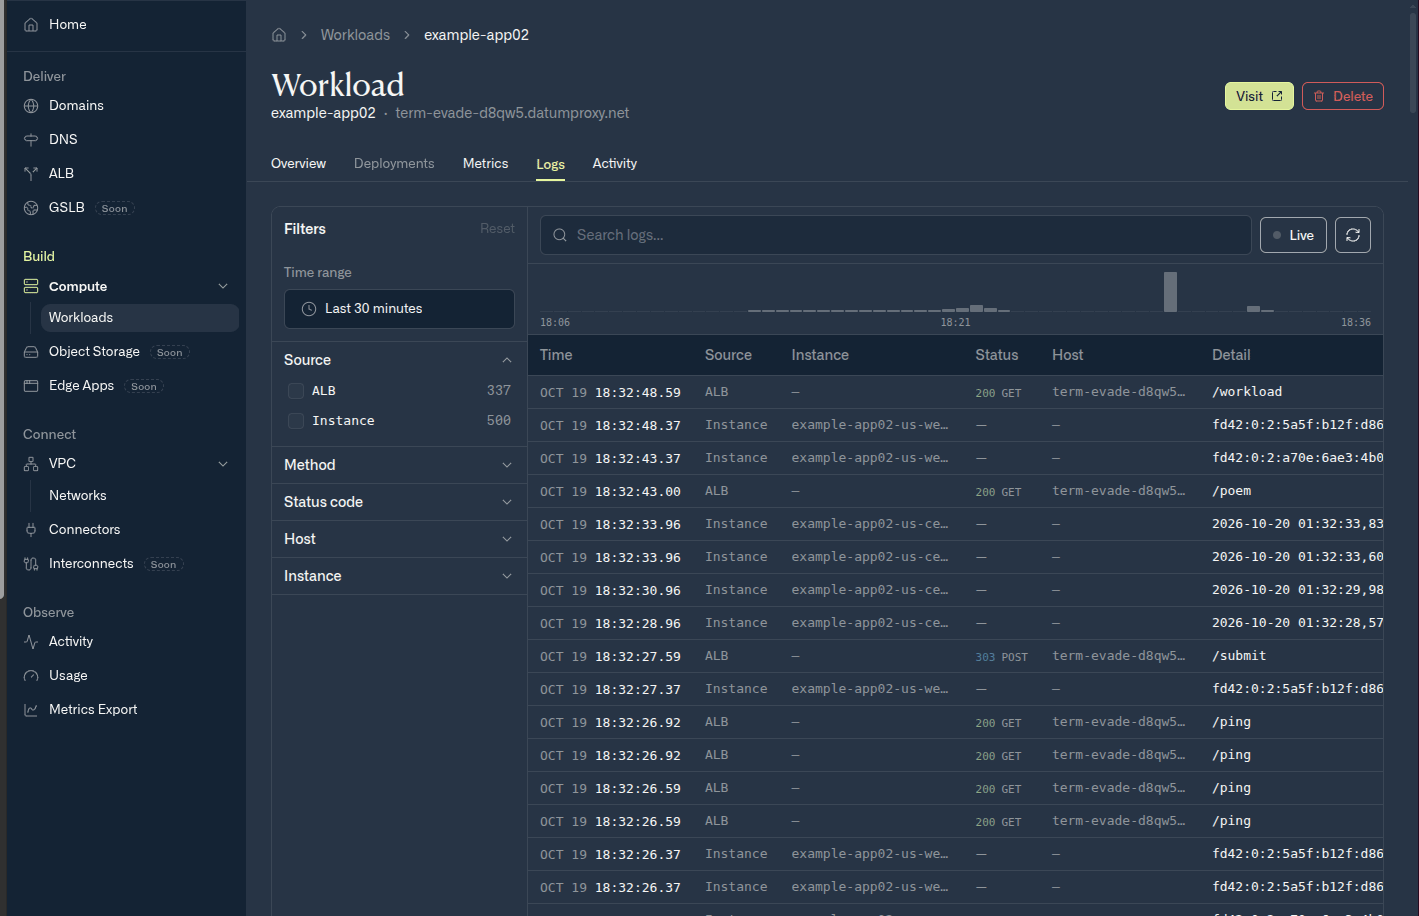
A workload's Logs tab, with Instance output and ALB access logs together
datumctl compute logs. Each line starts with the Instance it came from:
-ffollows new lines as they arrive.--location us-east-1and--instance NAMEnarrow the logs to some Instances.--search errorshows only lines that contain the text.--previousshows the logs of each Instance’s previous generation, such as before a crash or restart.--albshows the access logs of the workload’s load balancer instead.